InModeler Walkthrough

Left Toolbars
Attributes
As shown in figure 6, in the left toolbar, click on the attributes tab to open the Attributes panel. Click on the button or the attribute name to show all the labels of an attribute.
Click on the button next to the label name to show its values.

Facts Toolbar
In the left menu, click on facts to open the Facts panel to show all created facts. Moving cursor over fact name and clicking on icon the new tab with fact properties is created.
Creating a folder to organize your Facts and Attributes
All objects in your Inzata project can be grouped into folders. The folder can contain different types of objects, such as attributes, metrics etc. The folder is usually used to associate all objects of one cluster or to logically organize objects such as “basic metrics”,“percentage metrics”, “date attributes” etc.
A folder can be created in the list of any object, e.g. Attribute list, by clicking on the Add folder button at the bottom of the Attribute or Fact panels.

From there, you can give the new folder a. There is also the option to save the new folder as a Global Folder. Saving it as a Global Folder will make the new folder appear in other modules of Inzata (InBoard, InViewer). If you do not save it as a Global Folder, the folder will only appear in the panel in InModeler.
Click the Create button to finalize the and save the new folder, which is then added to the top of the Attribute and Fact panels as shown in figure 8.

To add items to folders, drag any object (attribute or fact) into the folder and drop it on the folder name. The added object moves from the main object list and will now appear in the folder.
Double click on the folder name for showing the folder properties as seen in figure 9.
Overview (Overview Tab)
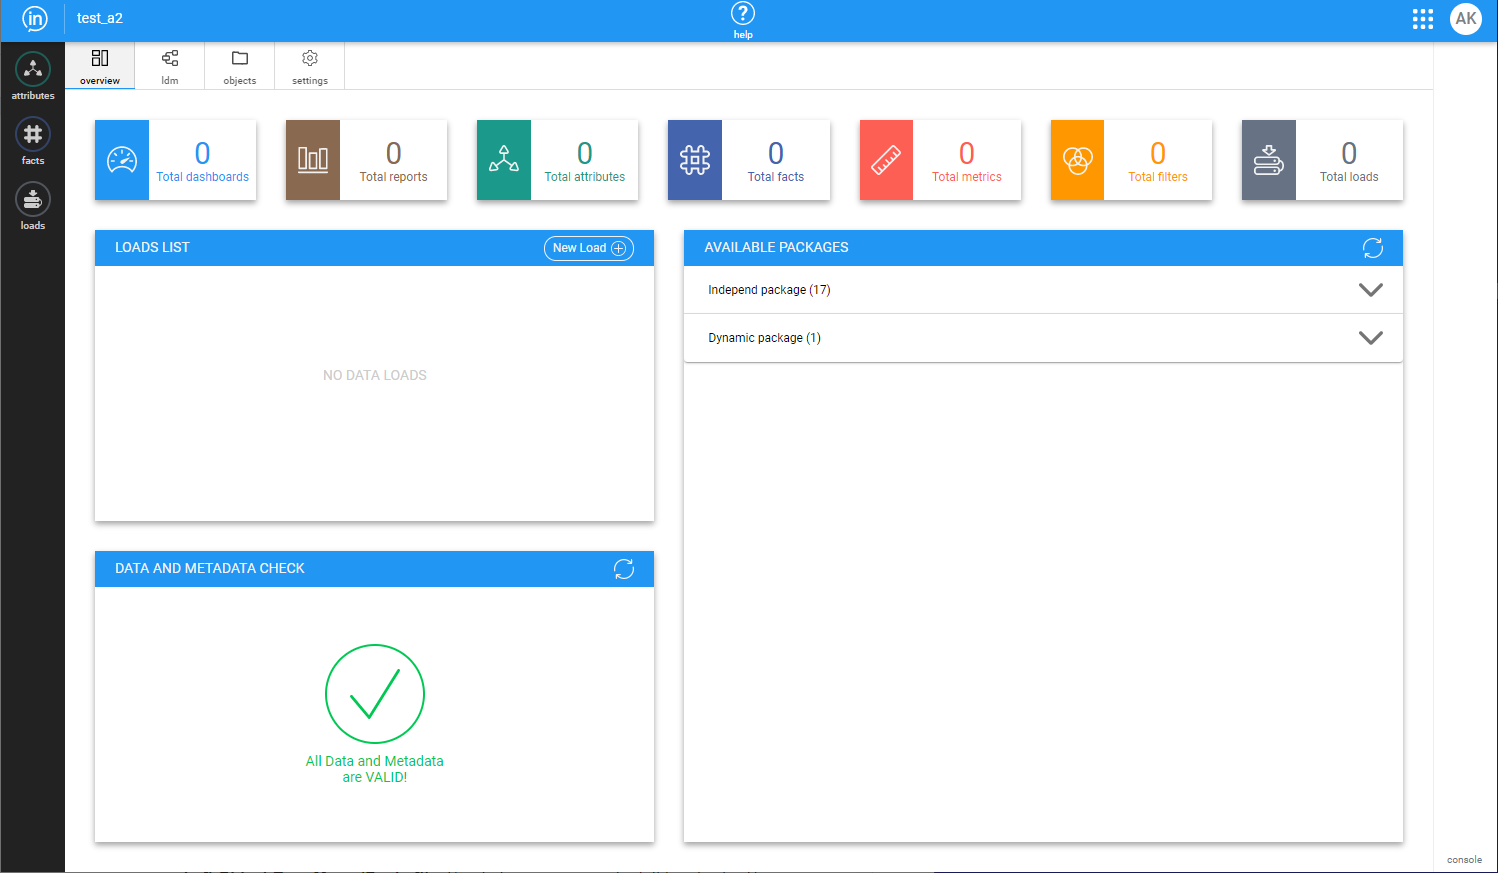
In figure 1, the colored boxes displayed horizontally along near the top of the webpage show the count for each aspect of a given Inzata project. Below that count bar, there are three windows:
- Loads List
A list of all loads
- Data and Metadata Check
The physical and logical models are automatically checked and the results are shown in this window. This can be used to debug errors that may appear as a data model is created. - Available Packages
This is described in the “Connecting a package into a cluster” section below.
Logical Data Model (ldm tab)

This tab displays the logical data model of a project. The model (LDM) shows the relationships among attributes and facts as they are defined in the project’s metadata. The lower level (right side) of a cluster is represented by facts while the second level (middle) is represented by the primary keys of the clusters. The other attributes displayed on the highest level (left side) are related to the primary key that they are connected to by lines.
The blue boxes denote facts and the green ones are attributes, the dark green-accented boxes are the primary keys in their respective clusters. Setting the cursor over the graphic symbol and then clicking will highlight an object’s relations. A user can click on a relation to keep it highlighted in a model (suitable when scrolling in larger LDM to follow the link between objects). Your model can be zoomed in or zoomed out using a mouse scroll bar or buttons in the tab at the bottom of the screen.
The right side of your screen contains the Properties Type toolbar:

- Spaces
The Spaces menu defines the levels of model display. It can be used to filter objects by type.
- Join
The Join menu is used to define join attributes between 2 clusters, when integrating originally separated clusters (source files) into one unified, enterprise LDM. This action is described in the “Join of loads” section below.
- Hierarchy
This tool allows you to place two attributes into a hierarchy (Parent-Child) relationship. Simply drag the parent attribute into the parent location, and the child attribute beneath it. You can create multi-level hierarchies as well by using the child attribute of one hierarchy as the parent of another. These relationships will be displayed as a horizontal row in the data model.
- Conversion
This allows you switch an individual object’s classification from Attribute to Fact, or from Fact to Attribute.
- Relation
This tool allows you to check whether a relationship exists between two objects, for example before creating a manual join.
Objects (objects tab)

The objects page in figure 11 displays all the metrics, facts, and attributes in a given project, along with different characteristics of those objects. The different columns in order of left to right are:
- Checklist
Checklist for selecting objects. These selected objects can then be shared so that different users can access them by using the button in the panel on the right, under the word “selected”. - Name
The name assigned to a given object to help the users identify the object. - Ident
The ID that is given either by the system or the user to an object that distinguishes it from the other objects. - Type
The type of an object describes its purpose or usage within the project, IE attribute, fact, metric, dashboard. - Creator
This is the user’s name who created the object initially. - Clusters
A group of objects associated with a file source. If two or more clusters are integrated by joining, then this column will list all the clusters that an object is related to. It is possible that all the clusters are integrated into one, cohesive data model, leading to every attribute, fact, and metrics being able to relate to each other. - Modified
This will list the last date and time that an object was modified. - Acl
The Access Control List shows the different users that have access to an object. - Description
The system or user assigned description of a given object. There does not necessarily need to be a description for every object. One such case would be when the name of the object clearly, accurately, and sufficiently describes the object

