Report by Report Filtering (Basic)
1. Create the report that will be used to filter.
To begin, create the report that will generate the list of attributes to filter the final report by (ie. customers who purchased a specific item in a specific year). Be sure to drag a metric in first (make sure it comes from the cluster furthest to the right in the data model of the attributes that will be brought in), then the attributes. The only necessary attribute is the one that will be used to filter (ie. Customer_ID) but it can be helpful to validate the first control by bringing in other related fields (ie. PRODUCT_CATEGORY and TRANS_DATE YEAR). It may be necessary to apply the TOP filter if the Browser Row Exceeded message pops up.
For this example, only people who purchased in 2019 will be considered in the original list so create a filter in the “BASIC” view by clicking the three dots on the right of the Trans_Date Year in the Rows box and searching for then selecting 2019 and then clicking Done at the top of the box.
Once all of your permanent filters are placed on the report, add a prompt filter using the button under the Filter box. Here is the final page that showing an example of selections:
At this point remove the TOP filter if it was applied (it’s okay if the warning shows up again – it can be ignored). Also, remove all of the extra attributes besides the one that will be piped into the other report.
2. Create the final report.
Now bring in a new Report widget and build out the final report. Remember to bring in a metric first.
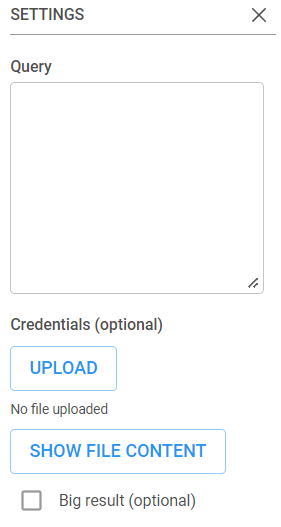
3. Copy the AQL of the first report.
In the AQL tab on the far right, copy everything before the “ROWS AS”:
4. Paste the first report into the AQL of the final report.
In the AQL tab of the final report, right before “ROWS AS”, type in “AND IN ()”. (Shown in Yellow)
Now, paste the AQL from the first report in between the ( ). (Shown in yellow)
Between the AND and the IN, copy and paste in the name of the attribute you want from the first report (ie. CUSTOMER_ID). Make sure to use the same label (ie. text or ID) in both. (Copied from in blue, pasted is in yellow)
Then click “Execute” and the report will update with the correct list of customer IDs. The first report can be deleted.
Make sure to name the Dashboard and save it!

