Inzata Support

Inzata Support

Did You Know?

Inzata's visuals are powered by the formidable D3.js library of more than 800 visual elements

Dashboards

Estimated reading: 4 minutes 57 views

Dashboards are the how data is presented visually to viewers. Dashboards are interactive and designed for viewers to easily browse and explore data, view reports, activate and use filtering, and obtain business insights from the data. Dashboards are made up of various types of widgets that work together to present information visually and effectively!


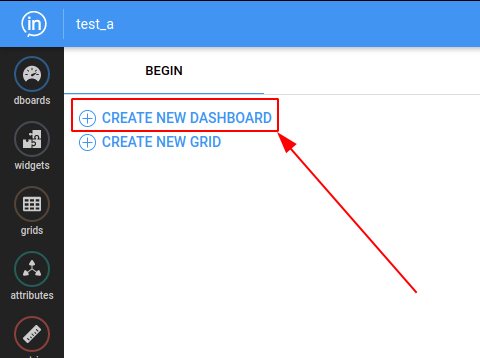
There are two ways to create a new blank dashboard. Method 1 is: when you enter InBoard you will be presented with the option to create a new dashboard or grid.

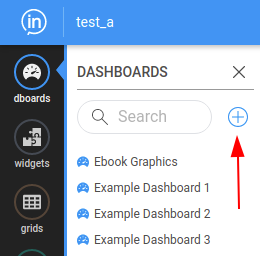
The second way is to open the “dboards” option within the objects menu and click the blue plus button.

The new dashboard’s properties instantly pop up on the right menu.  Give your new dashboard a descriptiive name, and add an optional description if you wish. 

You can also set Dashboard-level settings here such as themes and page orientation. This is useful if you want your dashboards to line up nicely for export to PDF or printing.

The first three fields in this menu are for identifying and describing your dashboard:
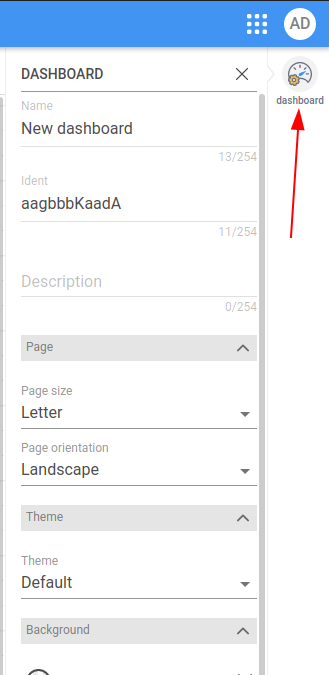
  • Name – Name your dashboard. This will be the name displayed in the open tabs bar as well as the Dashboards menus. This dashboard name can be changed at any time.
  • Ident – This is the unique identification number of your dashboard.  This value cannot be changed by the user.  It’s how Inzata will keep track of the multiple dashboards you’ll eventually create, even if two dashboards share the same name.  
  • Description – Optional: You can enter a brief description about the dashboard


Additional Dashboard Settings.  Note: To reset any settings to default values, click the X icon next to any of them.

 From top to bottom, the items are:

  • Page Size – The size of the page for PDF exporting or printing, this determines where the guides for page breaks appear on the layout screen.
  • Page Orientation – The orientation of the page for PDF exporting. The options are either landscape or portrait.
  • Theme – Inzata offers a number of colorful themes that can help your dashboard really stand out.  Themes use combinations of colors, fonts and other visual elements.  They’re a great way to visually unify all of your dashboard’s elements.  Careful!  Changing the dashboard theme will reset all of the individual color and font settings in each of your dashboard widgets.  
  • Dashboard Color – This changes the color of the background dashboard canvas. This will be the color shown behind the widgets and in any empty space between them.
  • Width – This is used to set different vertical width constraints for the dashboard, in the event you want to make a dashboard layout that is viewable on smaller screens, like smartphones. The options, from narrow to wide, left to right, are “xS”, “S”, “M”, “L” and “M” (max). It is recommended you leave this set to Max for the majority of desktop and laptop viewing. 
  • Background – This changes the color of the dashboard background as well as the default widgets color.  It will affect all widgets on the dashboard.
  • Widget Style – Border – This option lets you set the color and style of widget borders.
  • Radius – This lets you set the the radius for rounded corners of your widgets.  A larger radius will give a more rounded corner.
  • Spacing – Allows you to set empty space between widgets.  The color of th empty space will. be the dashboard background color you set above. Try setting a slight color contrast between your widgets and the dashboard background to give them a nice accent.  The more contrast, the more your widgets will “pop” off of the page.
  • Drop shadow – Sets the size of the drop shadow for each widget, use this to give a slight 3D effect to your dashboard.
  • Text Color – Changes the color of text within non text widgets for the whole dashboard
  • Font Family – Chooses the style of text displayed on the whole dashboard.  Font sizes can be set within each widget.  Caution: changing the font here affects the entire dashboard and will reset the font for every widget.


Inzata Dashboard settings:


Figure:  Inzata Themes Color Palettes:

Facts, Attributes, and Metrics

Facts, Attributes and Metrics What are they? How do they work? – https://h...

Sprint review 151

We made numerous UI changes as part of the step-by-step redesign of the entire a...

Sprint review 148 – from End-User perspective

InBoard: Widget Map redesign in Dashboard ability to add more layers to the map:...

Sprint review 149

Sprint review 149 – from End-User perspective App: Be able to impersonate ...

New Feature Releases/Change Logs

Snowflake DB

Configure Inzata’s connector to automate ingestion of data from Snowflake ...

Push Process

How does it work? The PUSH process facilitates the smooth propagation of changes...

FAQ – Data Enrichment

FAQ – Modeling Data

FAQ – Loading and Moving Data

FAQ – General

What is Inzata? Inzata is a Data Analysis Software platform, Inzata is the faste...

FAQs

Chat Icon Close Icon