Widgets
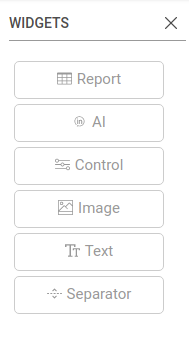
Widgets are the items that make up a dashboard. There are currently 6 types of widgets within Inzata. These can be added to a dashboard by dragging them from the widgets list within the objects menu.

Widgets within a dashboard can be moved by clicking and dragging the widget to wherever you want it to go. All widgets within inzata will automatically gravitate to the top of the dashboard in order to make the dashboard easier to navigate. Any widgets can also be resized by dragging the arrow in the bottom right of the widget. You can also copy any existing widget by clicking the copy button that appears in the top right when hovering the mouse over the widget. You can also remove any widget by clicking the garbage can that also appears in the top right when hovering over a widget. You also have the option to sort some report widgets via the sort button that appears in the same location. When this sort button is clicked it will present the options available for sorting the report by a desired metric or a desired attribute.
Report Widget
Reports are the most commonly used widget type. A report is how data is represented on a dashboard. All reports start their life as a table and can then be formatted to look like a different type of chart. How to make these tables will be covered in the “Grids” section since it works the same if you make the report directly in the dashboard or if you make the table as a grid first.
There are 4 options within the widget menu of the report widget. They are:
- Report
- Pivot
- Format
- AQL
AI Widget
The AI widget within Inzata requires a properly configured AI flow to have been previously set up and run within InFlow for information on how to do this please see the inFlow help document. The AI widget has two options from within the widget menu. They are:
- AI
- Format
Control Widgets
Control widgets are how the dashboard creator within Inzata can give the end user of a dashboard the ability to dynamically select or change what data is being shown by a report or a group of reports. Controls and reports have a many to many relationship, this is to say, a single report can be affected by many controls and a single control can affect many reports. This layering effect can allow an end user to have as much or as little flexibility as the dashboard designer wants to allow.
Image Widget
The image widget allows you to add an image to your dashboard. This is useful in the cases where maybe you want to include a map from some other platform or maybe a logo.
Separator Widget
This widget allows you to add a separator line to your dashboard.


