Report Widget
Reports are the most commonly used widget type. A report is how data is represented on a dashboard. All reports start their life as a table and can then be formatted to look like a different type of chart. How to make these tables will be covered in the “Grids” section since it works the same if you make the report directly in the dashboard or if you make the table as a grid first.
There are 4 options within the widget menu of the report widget. They are:
- Report
- Pivot
- Format
- AQL
Report Menu
This menu reminds the users that a report is an element of a dashboard.
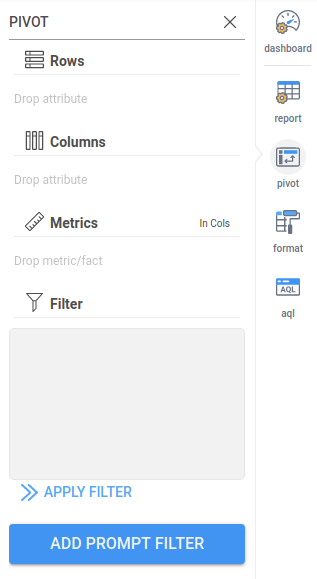
Pivot Menu
This menu is how a user creates the report itself:
- Rows – Any attributes dropped here will be shown as rows of the report widget.
- Columns – Any attributes dropped here will be shown as columns of the report widget.
- Metrics – This is the item to be aggregated/broken down by the attributes.
- In Cols / In Rows – This button changes metrics from being represented side by side or above and below one another.
- Filter – This is how to exclude/include specific data within a report. Whenever a filter is editied, the below “APPLY FILTER” button must be clicked to update the report with the new, changed filter.
- Add Prompt Filter – This button is used to open a wizard to help the user create a control
Format Menu
The format menu is how the appearance of a report widget is changed. Inzata has many different visualization options. Experiment with different visualizations by changing the display as option to other report types and changing attributes from rows to columns.

AQL Menu
This menu shows how the report is represented within Inzata. This is able to be edited directly for advanced customization of the report or is able to be copied to replicate a report on another dashboard.


